
26 Graphs and Charts Filled With Interesting Info
Nathan Johnson
Published
12/02/2022
in
wow
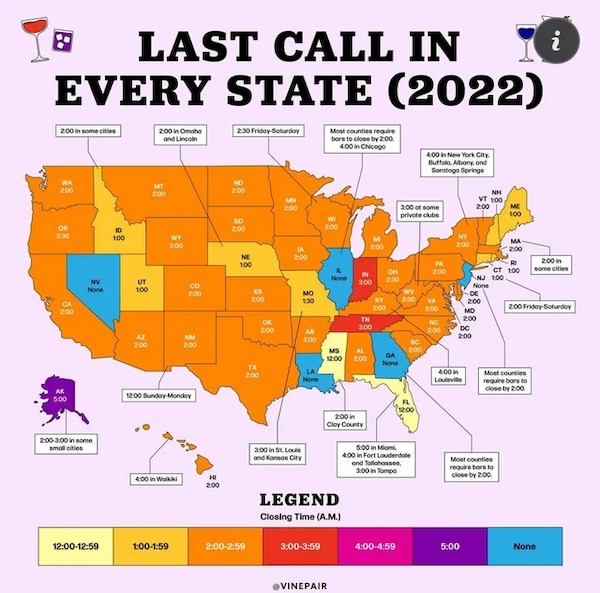
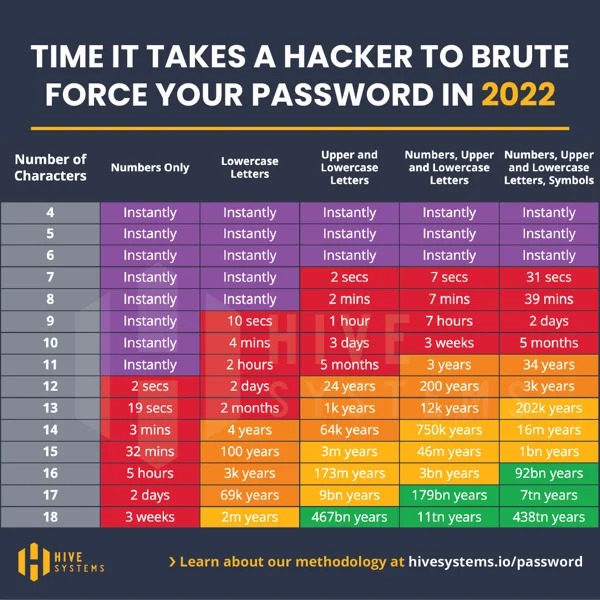
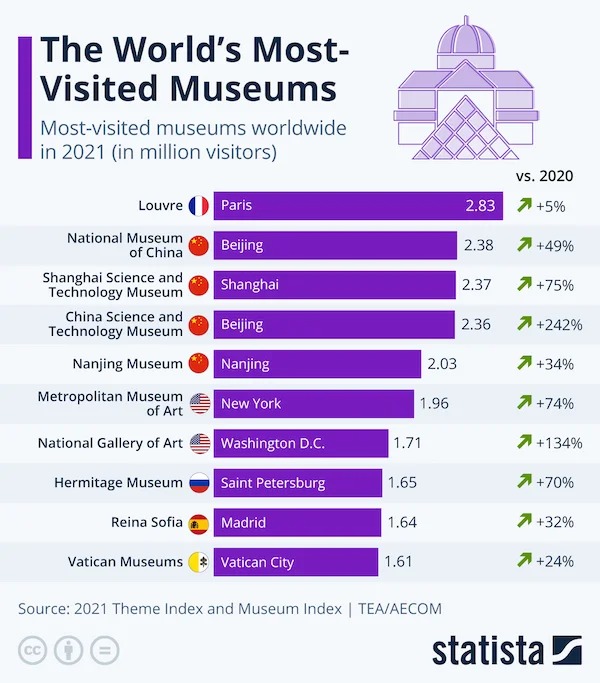
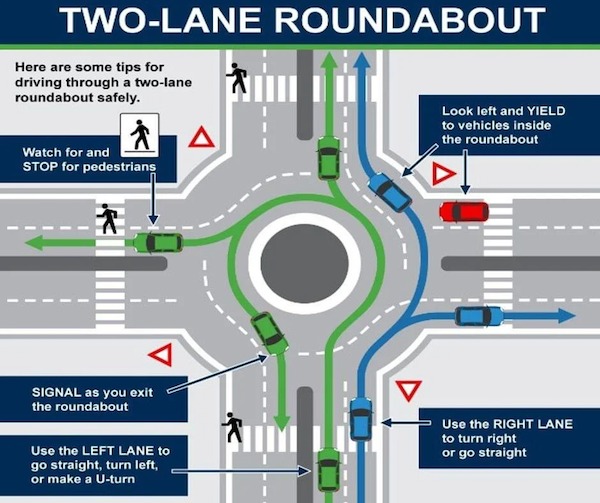
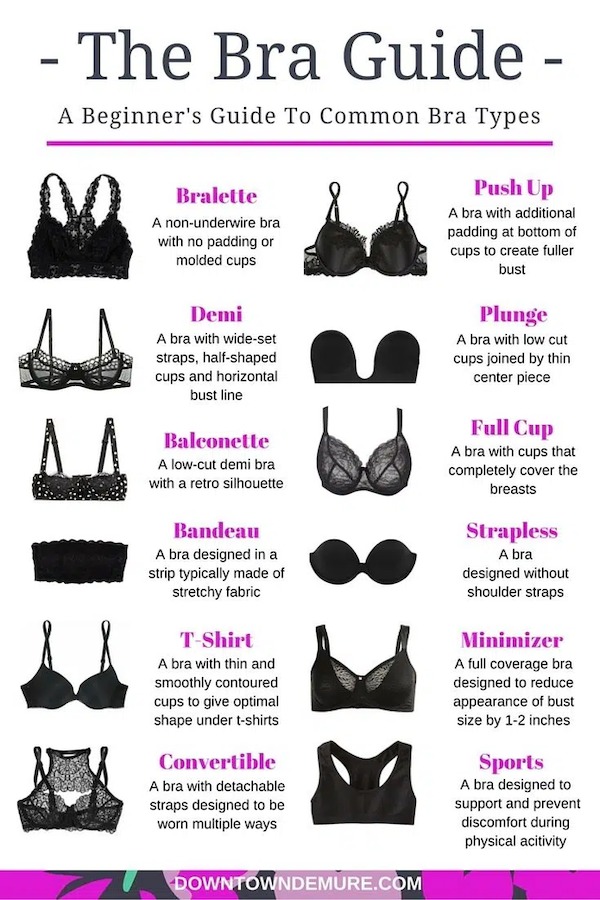
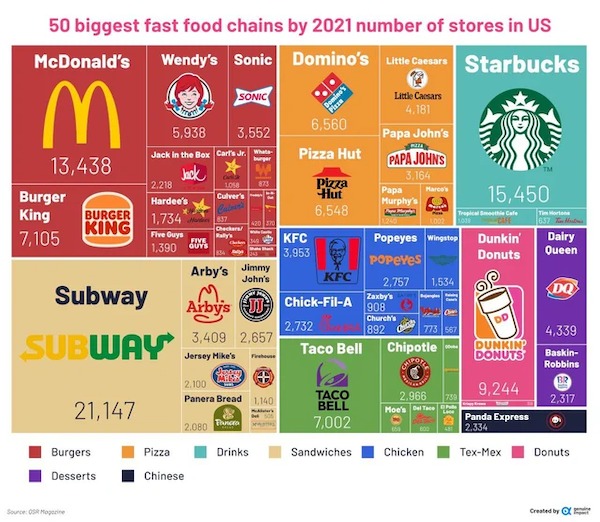
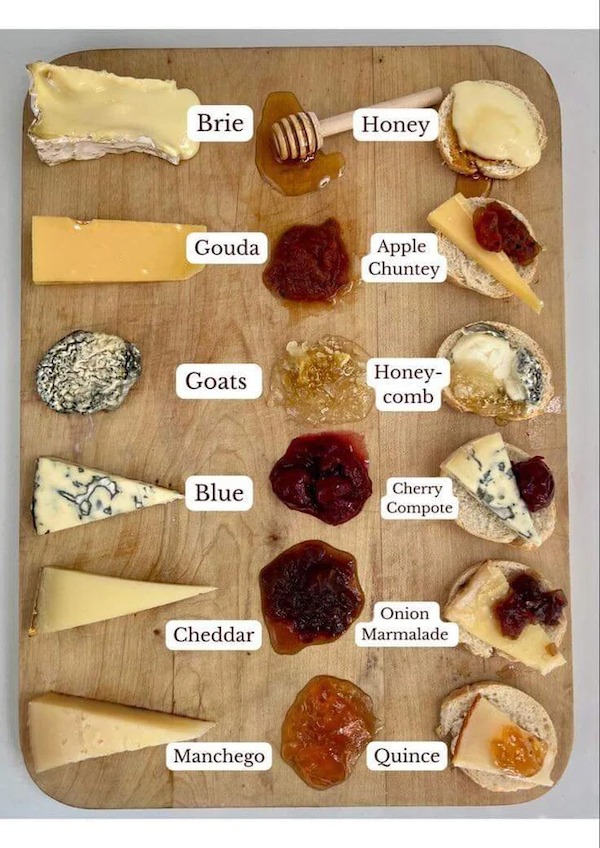
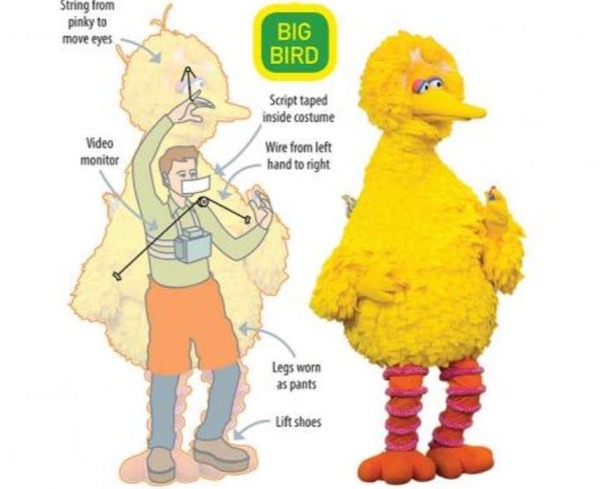
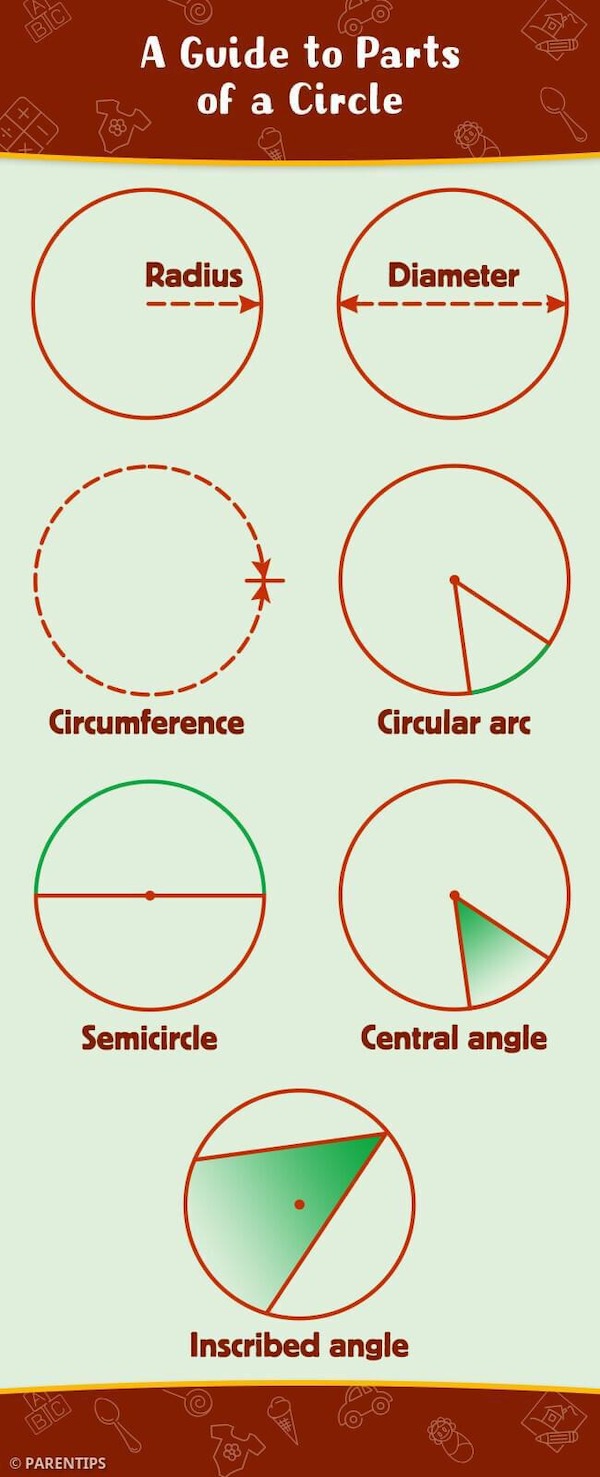
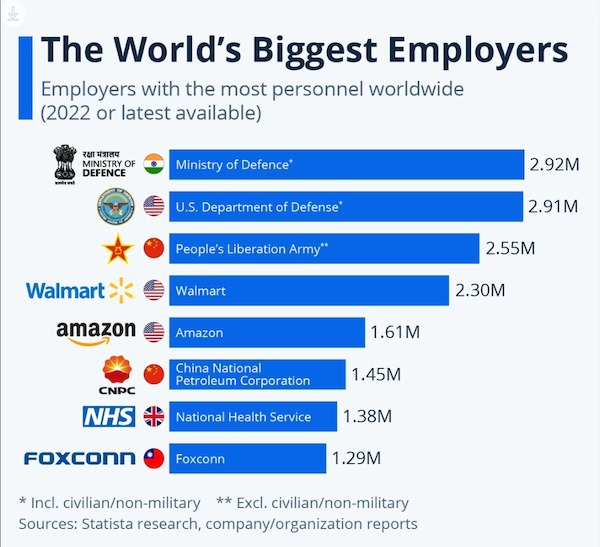
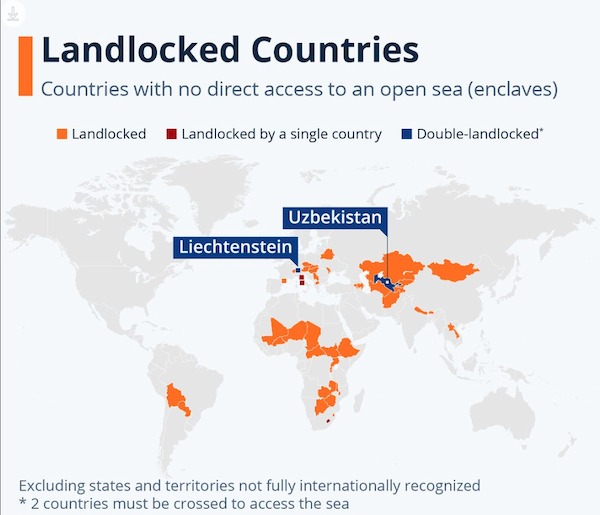
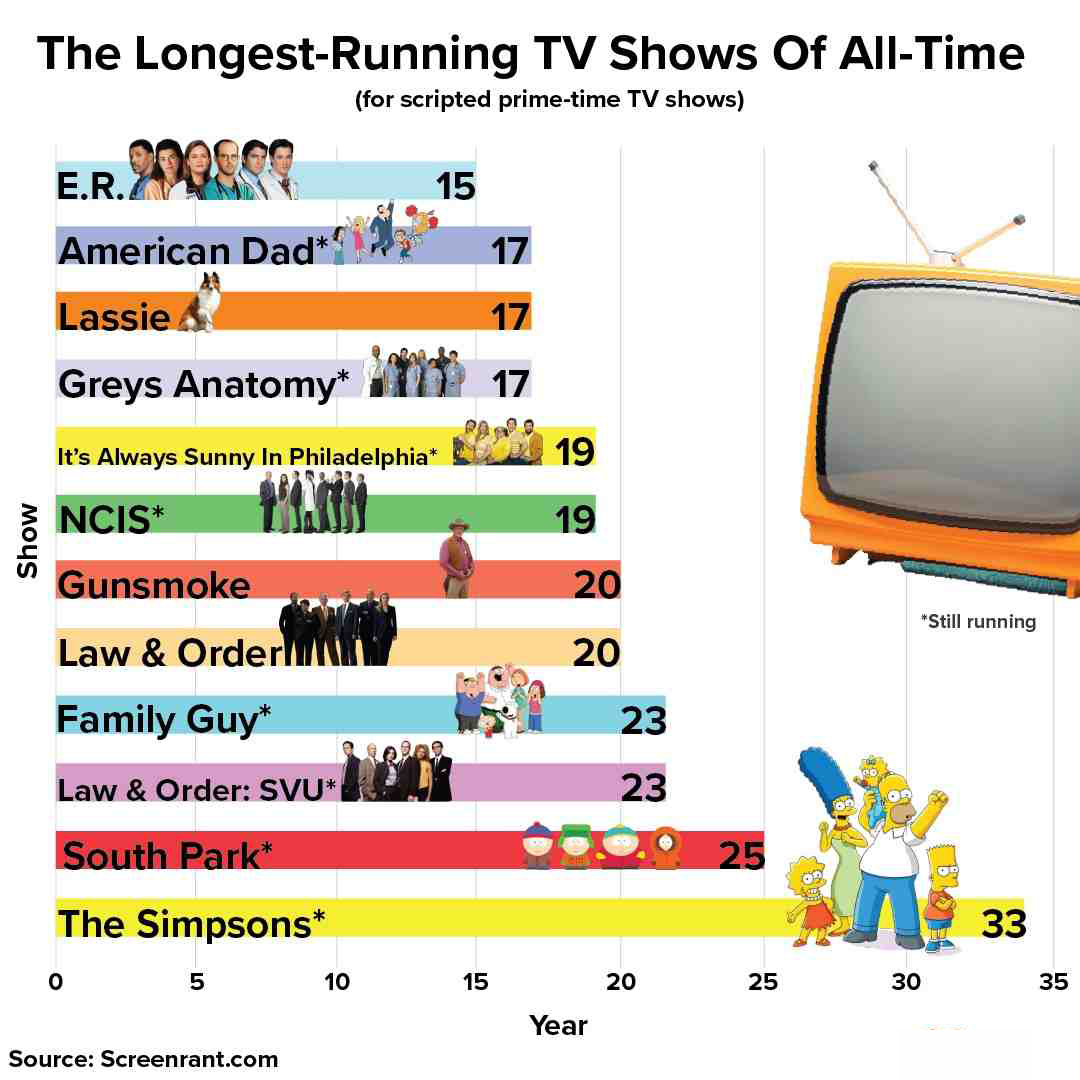
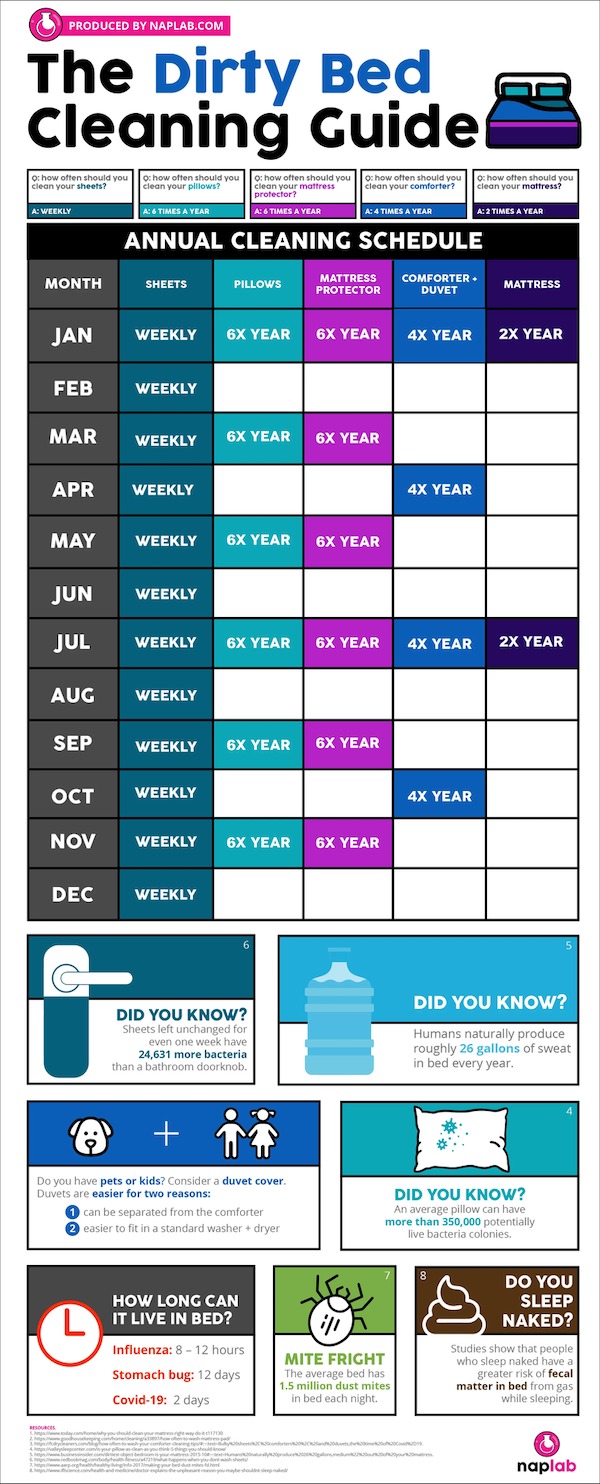
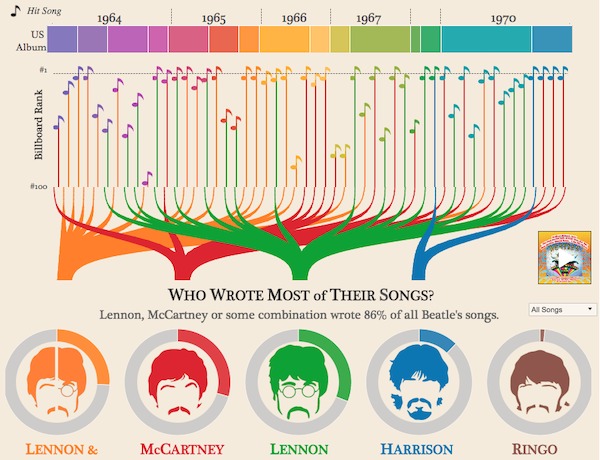
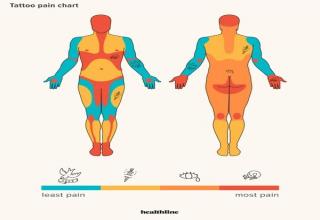
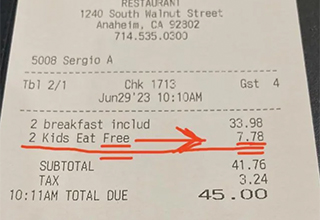
The world has an endless supply of facts, data, and statistics. It can be hard to digest info sometimes when all you have is numbers on a white screen or piece of paper. Visualizing the data in charts and infographics can make it much easier to understand, and more enjoyable to read. Check out this batch of graphs, data, and infographics that prove there's a chart for almost anything.
- List View
- Player View
- Grid View
Advertisement

-
1.
-
2.
-
3.
-
4.
-
5.
-
6.
-
7.
-
8.
-
9.
-
10.
-
11.
-
12.

-
13.
-
14.
-
15.
-
16.
-
17.

-
18.

-
19.
-
20.
-
21.
-
22.
-
23.
-
24.

-
25.
-
26.
- REPLAY GALLERY
-

- 26 Graphs and Charts Filled With Interesting Info
- NEXT GALLERY
-

- 25 Satisfying Pics to Soothe the Soul
26/26
1/26


7 Comments