
29 Charts Filled With Wonderful Data
Nathan Johnson
Published
06/26/2023
The world is full of wonder, and no one knows this more than the fine folks of r/dataisbeautiful who have made it their quest to help us visualize data in cool and unique ways.
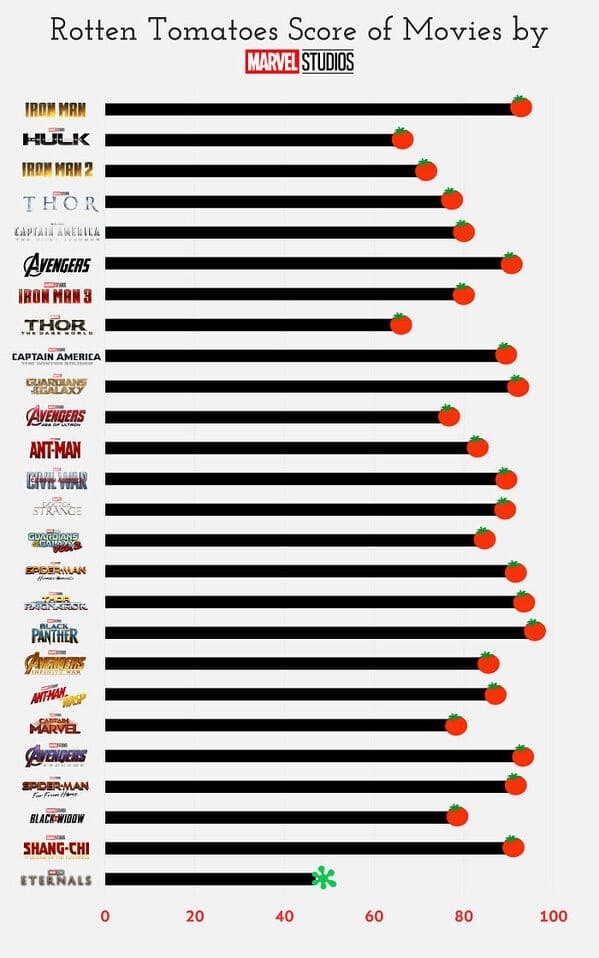
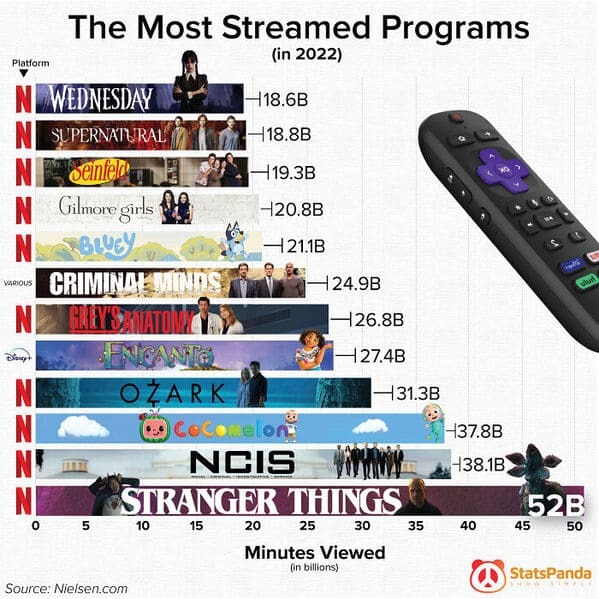
Have you ever wondered who has the most Oscars? Or what TV shows are the most watched of all time? Well, there's a graph for that.
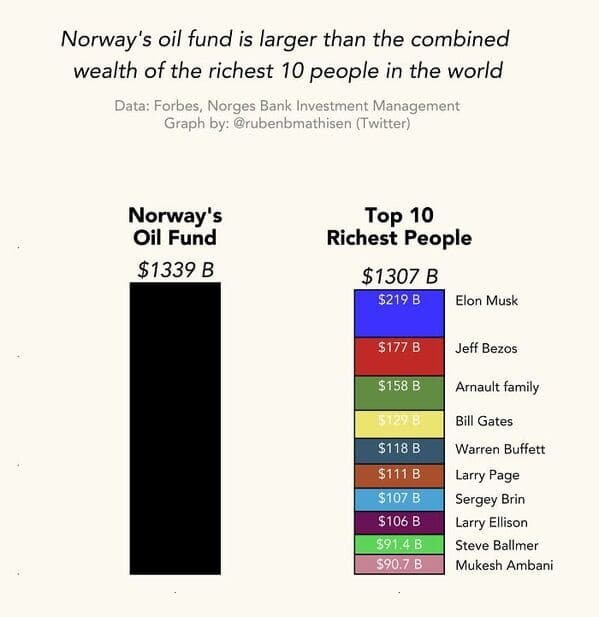
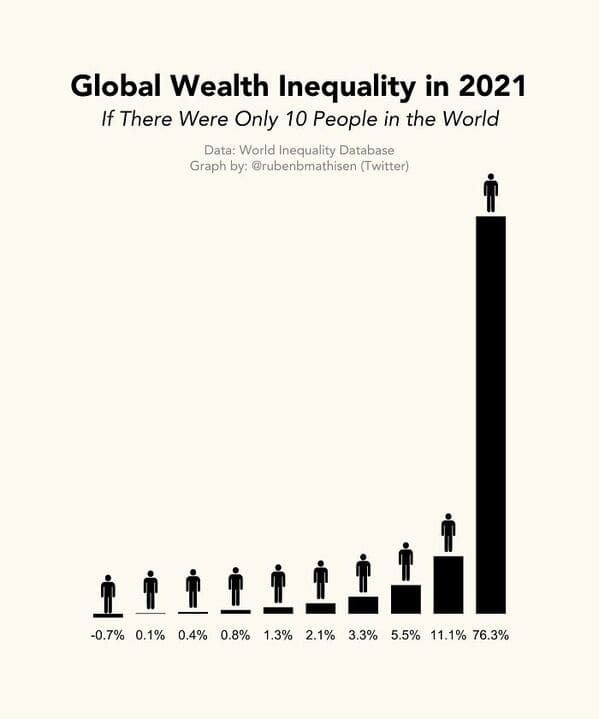
Or maybe you want to see how insane the wealth distribution in the U.S. has become. There's a graph for that.
No matter what you're looking to learn about, chances are you aren't the first. So do yourself a favor and strap on your thinking cap, because this is the beautiful world of data.
- List View
- Player View
- Grid View
Advertisement

-
1.
-
2.
-
3.
-
4.
-
5.
-
6.
-
7.

-
8.
-
9.
-
10.
-
11.
-
12.
-
13.
-
14.
-
15.
-
16.

-
17.
-
18.
-
19.
-
20.
-
21.
-
22.
-
23.
-
24.
-
25.
-
26.
-
27.
-
28.
-
29.

- REPLAY GALLERY
-

- 29 Charts Filled With Wonderful Data
- NEXT GALLERY
-

- 37 Examples Of Cosplay and Costumes Done Right
29/29
1/29


0 Comments